


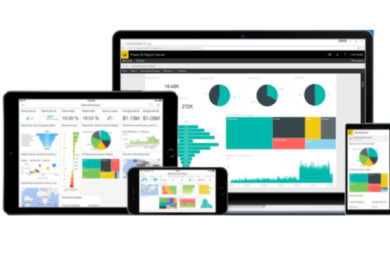


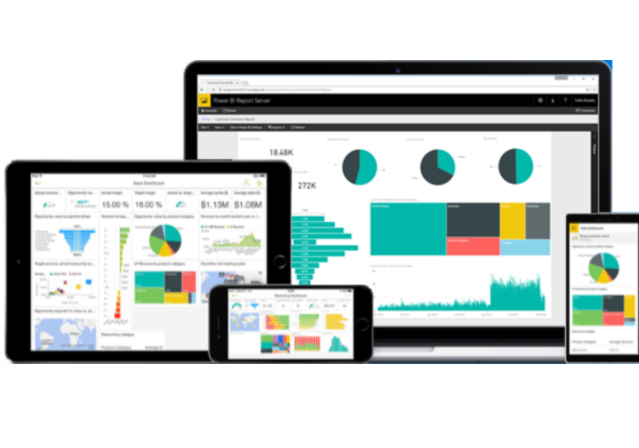
The following programs are used to “give life to data” by constructing easy-to-understand graphs:
<<You have an idea. You have the data. Power BI brings it to life. Power BI publish to web lets you create data stories with amazing interactive visualizations and publish them to your blog or website in minutes.>>
Qlik® delivers intuitive platform solutions for self-service data visualization, guided analytics applications, embedded analytics and reporting to approximately 45,000 customers worldwide. Companies of all sizes, across all industries and geographies, use Qlik solutions to visualize and explore information, generate insight and make better decisions. At Qlik, we optimize Business Intelligence (BI) by harnessing the collective intelligence of people across an organization. We focus on empowering people—by enabling everyone in an organization to see the whole story that lives within their data.>>